Introduction
Water quality monitoring requires accurate and reliable measurement methods to understand changes in water conditions.
Among different water quality parameters, turbidity measurement plays an important role because it directly reflects the presence of suspended particles, colloids, and other light-scattering substances in water.
A turbidity analyzer provides continuous measurement of water clarity by detecting how particles affect light transmission and scattering.
It is widely used in:
- Drinking water treatment.
- Industrial wastewater treatment.
- Power plant water systems.
- Beverage production.
- Pharmaceutical water systems.
- Process water monitoring.
However, selecting the right turbidity analyzer is not only about choosing the correct NTU measurement range.
Engineers also need to consider:
- Water characteristics.
- Suspended solids concentration.
- Measurement accuracy requirements.
- Installation conditions.
- Cleaning requirements.
- Communication and automation needs.
For example, a low-turbidity boiler feed water system and a high-load industrial wastewater application require completely different monitoring solutions.
This guide explains:
- What a turbidity analyzer is.
- How turbidity measurement works.
- The role of turbidity sensors.
- Common turbidity testing methods.
- How to choose the right turbidity analyzer.
- Real industrial application cases and troubleshooting experience.
What Is a Turbidity Analyzer?
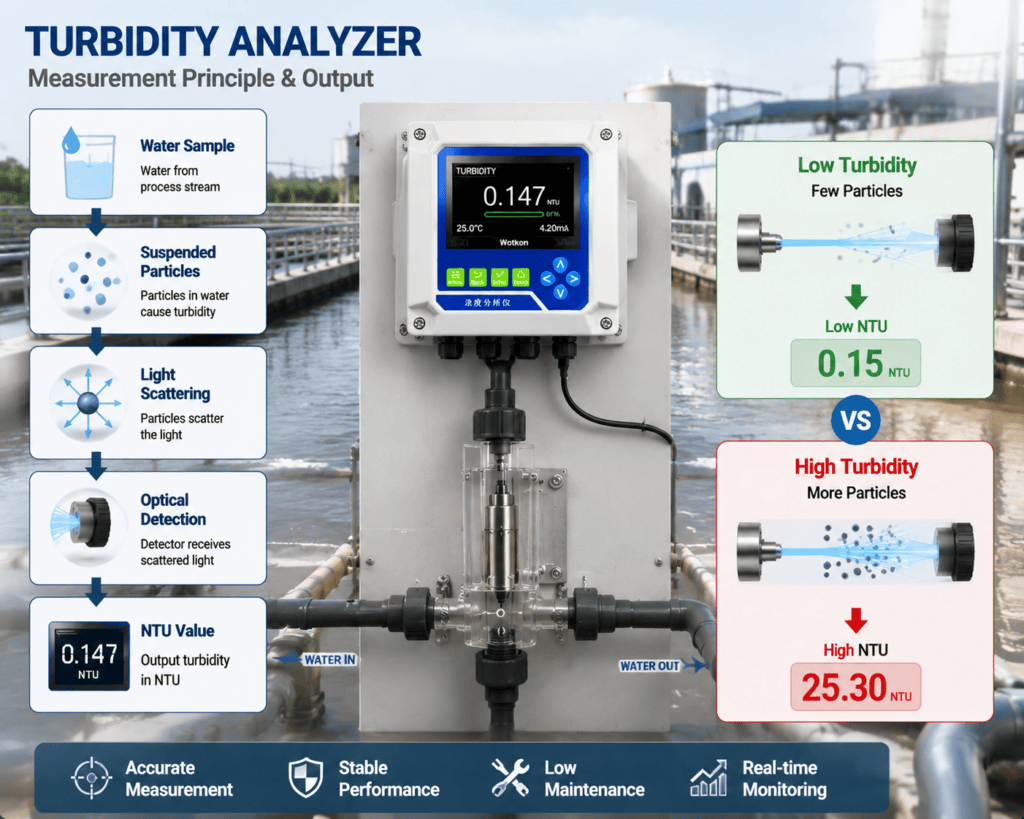
A turbidity analyzer is an instrument designed to measure the cloudiness of water caused by suspended particles.
These particles may include:
- Suspended solids.
- Organic matter.
- Microorganisms.
- Colloidal particles.
- Inorganic particles.
Unlike parameters such as pH or conductivity, turbidity does not measure dissolved substances.
Instead, it measures the optical effect caused by particles suspended in the water.
When more particles are present:
- More light is scattered.
- The detected signal increases.
- The turbidity value becomes higher.
The measurement result is usually expressed as:
- NTU (Nephelometric Turbidity Unit)
- FNU (Formazin Nephelometric Unit)
Understanding Turbidity and NTU Measurement
What Does Turbidity Represent?
Turbidity indicates the degree to which suspended materials reduce water transparency.
Clear water allows light to pass through with minimal interference.
However, when particles exist in water:
- Light is absorbed.
- Light is reflected.
- Light is scattered.
The turbidity analyzer detects these changes and converts them into measurable data.
Why NTU Measurement Matters
NTU measurement provides valuable information for many industrial processes.
For example:
Drinking Water
Turbidity monitoring helps verify:
- Filtration performance.
- Treatment efficiency.
- Final water quality.
A sudden increase in turbidity may indicate:
- Filter damage.
- Particle breakthrough.
- Treatment abnormalities.
Wastewater Treatment
In wastewater applications, turbidity helps evaluate:
- Clarification efficiency.
- Biological treatment performance.
- Final discharge quality.
Changes in turbidity may indicate:
- Sludge carryover.
- Poor sedimentation.
- Process instability.
Industrial Water Systems
Industrial facilities use turbidity monitoring to protect equipment and improve reliability.
Typical applications include:
- Boiler feed water.
- Cooling water.
- Water reuse systems.
- Pretreatment systems.
Stable turbidity measurement helps:
- Detect contamination.
- Protect downstream equipment.
- Optimize operation.
Why Turbidity Monitoring Matters
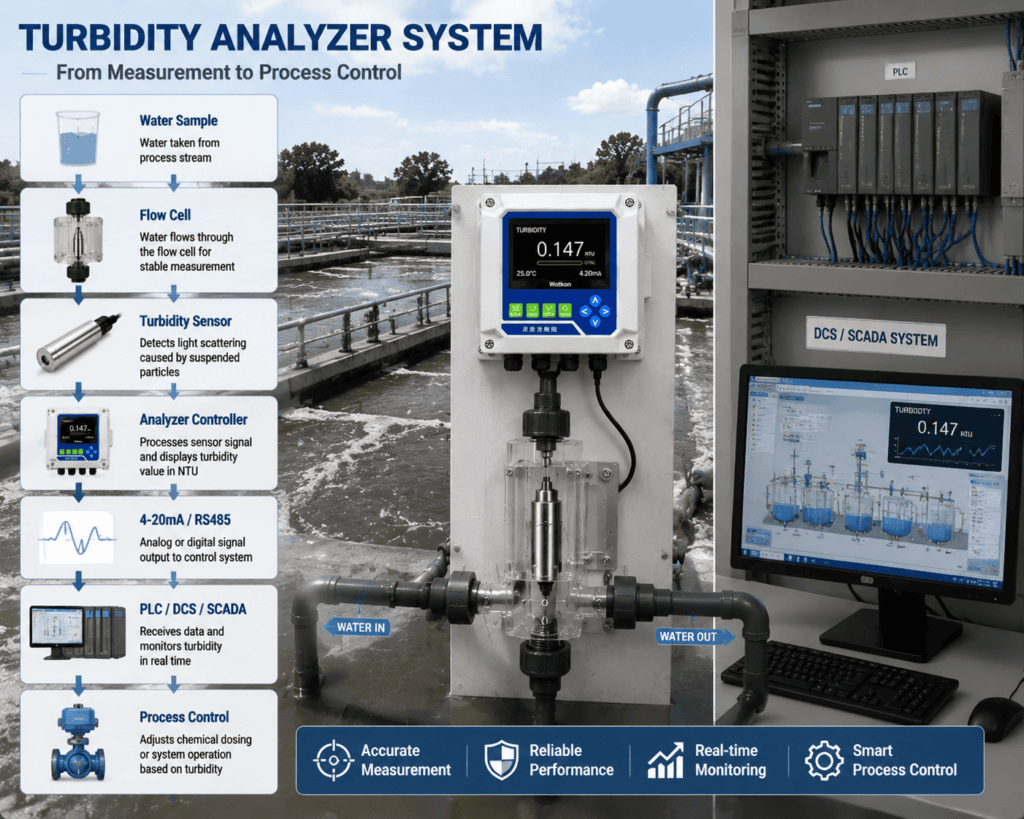
Traditional water quality testing often relies on manual sampling and laboratory analysis.
Although laboratory testing provides accurate results, it has several limitations:
- Limited measurement frequency.
- Delayed detection.
- High labor requirements.
- Lack of continuous historical data.
For applications where water quality changes quickly, periodic testing may create monitoring blind spots.
An online turbidity analyzer provides:
- 24/7 continuous measurement.
- Real-time abnormal condition detection.
- Automatic data recording.
- Integration with PLC/DCS systems.
This allows operators to respond faster and improve process control.
How Does a Turbidity Analyzer Work?
A turbidity analyzer mainly works based on the light scattering measurement principle.
The measurement process includes several steps:
Step 1: Light Emission
A stable light source, usually an LED, sends light into the water sample.
Step 2: Particle Scattering
Suspended particles in the sample scatter the incoming light.
The amount of scattered light depends on:
- Particle concentration.
- Particle size.
- Particle characteristics.
Step 3: Optical Detection
A photodetector measures the scattered light intensity.
Most turbidity analyzers use a nephelometric measurement method, where the detector measures scattered light at approximately 90 degrees from the original light path.
Step 4: Signal Conversion
The analyzer converts the optical signal into an NTU value.
The final result is displayed and can be transmitted to:
- PLC.
- DCS.
- SCADA.
- Data management systems.
Light Scattering Measurement Principle
The basic principle can be summarized as:
When the water contains fewer particles:
- Less light scattering occurs.
- The NTU value remains low.
When particle concentration increases:
- More scattered light reaches the detector.
- The NTU value increases.
Factors Affecting Optical Measurement Accuracy
Although turbidity measurement technology is mature, practical accuracy depends on the complete measurement system.
Important factors include:
Optical Window Condition
Deposits on the optical surface can change the light path and cause measurement drift.
Sample Flow Stability
Unstable flow may introduce:
- Air bubbles.
- Particle accumulation.
- Measurement fluctuations.
Installation Location
Incorrect installation may result in:
- Unrepresentative samples.
- Poor mixing.
- Sediment accumulation.
Therefore, selecting a suitable installation location is as important as selecting the analyzer itself.
Turbidity Sensor Components
The turbidity sensor is the core measurement component of the turbidity analyzer.
A typical turbidity sensor includes:
1. Light Source
The light source provides a stable optical signal.
Common requirements include:
- Long service life.
- Stable intensity.
- Low drift.
LED light sources are widely used because of their reliability.
2. Photodetector
The photodetector receives scattered light signals.
Its performance affects:
- Measurement sensitivity.
- Resolution.
- Stability.
3. Optical Window
The optical window separates the sensor components from the water sample while allowing light transmission.
Because it directly contacts the measurement environment, it is vulnerable to:
- Particle deposition.
- Scaling.
- Biofilm formation.
4. Measurement Chamber or Flow Cell
The measurement chamber provides a controlled environment for optical measurement.
A properly designed flow system helps:
- Maintain stable sample conditions.
- Reduce bubbles.
- Improve repeatability.
5. Automatic Cleaning System
For long-term industrial monitoring, contamination control is critical.
Advanced turbidity analyzers may include:
- Automatic air cleaning.
- Ultrasonic cleaning.
- Mechanical wiping systems.
These functions help reduce:
- Maintenance frequency.
- Calibration requirements.
- Measurement drift.
From Our Field Experience:
Why a Thermal Power Plant Upgraded from Manual Sampling to Online Turbidity Monitoring
For critical industrial water systems, periodic laboratory testing may not provide sufficient protection.
We worked with a thermal power plant where turbidity monitoring was applied to condensate water.
Before the upgrade, operators collected water samples every hour and performed laboratory turbidity testing.
Although this method provided basic water quality information, several limitations appeared:
- Measurement intervals created monitoring blind spots.
- Resin leakage could not be detected immediately.
- Manual sampling required significant labor.
- Continuous historical turbidity data was unavailable.
For power generation systems, condensate quality directly affects equipment reliability.
The customer needed:
- 24-hour continuous turbidity monitoring.
- DCS integration.
- Automatic turbidity alarms.
- Long-term data recording.
The facility was upgraded with an online turbidity analyzer connected to the plant DCS system.
Results After Implementation
After installation:
- Monitoring changed from one manual test every hour to continuous 24-hour monitoring.
- Water quality inspection workload decreased by 65%.
- Resin leakage and other abnormalities were detected within tens of seconds instead of several minutes.
- Turbidity data was automatically stored for operation analysis and traceability.
This project demonstrated that for critical industrial water systems, online turbidity monitoring provides faster response, continuous data visibility, and better equipment protection compared with periodic laboratory testing.
Turbidity Testing Methods
Turbidity measurement methods vary depending on the application requirements.
Different industries may use:
- Laboratory turbidity testing.
- Portable turbidity measurement.
- Online turbidity monitoring.
The correct method depends on:
- Measurement frequency.
- Required accuracy.
- Process importance.
- Need for automation.
Laboratory Turbidity Testing
Laboratory testing is commonly used for:
- Quality verification.
- Regulatory testing.
- Reference measurement.
The general process includes:
- Collect water samples.
- Prepare the sample.
- Remove bubbles or interference.
- Measure turbidity using a laboratory turbidimeter.
- Record the NTU value.
Advantages of Laboratory Testing
Laboratory testing provides:
- High measurement accuracy.
- Controlled testing conditions.
- Reference data for verification.
It is often used to validate:
- Online turbidity analyzers.
- Process improvements.
- Water treatment performance.
Limitations of Laboratory Testing
However, laboratory testing also has limitations:
- Results are not available immediately.
- Sampling frequency is limited.
- Short-term water quality changes may be missed.
- Requires manual operation.
For applications requiring continuous monitoring, laboratory testing alone may not be sufficient.
Portable Turbidity Testing
Portable turbidity meters are widely used for field inspection.
They are suitable for:
- Routine water quality checks.
- Equipment commissioning.
- Temporary monitoring points.
The operator collects a water sample and measures turbidity using a portable instrument.
Advantages of Portable Turbidity Testing
Portable instruments provide:
- Flexible measurement locations.
- Simple operation.
- Lower initial investment.
- Quick field verification.
Limitations of Portable Turbidity Testing
Because measurements are performed manually:
- Data frequency is limited.
- Operators may miss sudden changes.
- Automatic alarms are unavailable.
- Data recording depends on manual management.
Portable testing is suitable for inspection, but it cannot replace online monitoring in critical processes.
Online Turbidity Monitoring
An online turbidity analyzer is designed for continuous measurement.
It is commonly used in:
- Industrial wastewater.
- Drinking water treatment.
- Power plants.
- Process water systems.
The system continuously measures turbidity and sends data to control platforms.
Typical communication methods include:
- 4–20 mA.
- RS485.
- Modbus.
- Industrial Ethernet.
Advantages of Online Turbidity Monitoring
1. Continuous 24/7 Measurement
Online turbidity analyzers provide real-time information about water quality changes.
This helps detect:
- Sudden contamination.
- Filtration failure.
- Treatment instability.
2. Automatic Alarm Function
When turbidity exceeds a preset value, the system can automatically generate alarms.
This allows operators to:
- Respond quickly.
- Prevent equipment damage.
- Reduce environmental risks.
3. Data Recording and Traceability
Online systems automatically store historical turbidity data.
This supports:
- Process analysis.
- Compliance documentation.
- Equipment operation management.
Beverage Turbidity Testing Guide
Turbidity measurement is especially important in beverage production because appearance and consistency directly affect product quality.
Different beverage products may contain:
- Natural particles.
- Proteins.
- Colloids.
- Suspended components.
Small turbidity changes may indicate:
- Filtration problems.
- Raw material variation.
- Production process changes.
Step 1: Sample Preparation
Proper sample preparation is essential for reliable beverage turbidity testing.
Before measurement, operators should consider:
- Sample cleanliness.
- Temperature stability.
- Mixing condition.
- Bubble removal.
Incorrect preparation may create inaccurate results even when the instrument is working correctly.
Step 2: Sample Homogenization
For beverages containing suspended components, the sample should be mixed carefully.
The purpose is to:
- Distribute particles evenly.
- Obtain representative measurement results.
- Improve repeatability.
However, excessive shaking should be avoided because it may introduce air bubbles.
Step 3: Bubble Removal
Air bubbles are a common source of turbidity measurement error.
Because bubbles scatter light, they may be detected as particles.
This can cause:
- False high turbidity values.
- Unstable readings.
- Poor repeatability.
For carbonated beverages, proper degassing is especially important.
Common methods include:
- Gentle stirring.
- Waiting for bubbles to disappear.
- Proper sample handling.
Step 4: Temperature Stabilization
Temperature changes may affect measurement consistency.
Before testing:
- Allow the sample temperature to stabilize.
- Keep testing conditions consistent.
- Avoid large temperature differences between samples.
This improves comparison between different production batches.
Quality Control Standards and Compliance
Turbidity monitoring supports quality control across many industries.
Beverage Industry
In beverage production, turbidity measurement helps maintain:
- Product appearance.
- Batch consistency.
- Filtration performance.
Common monitoring points include:
- Raw water.
- Filter outlet.
- Production process water.
- Final product inspection.
Pharmaceutical Industry
Pharmaceutical water systems require strict water quality management.
Turbidity monitoring helps verify:
- Purification system performance.
- Filtration efficiency.
- Water quality stability.
Industrial Water Treatment
Industrial facilities use turbidity measurement to monitor:
- Pretreatment systems.
- Filtration units.
- Water reuse systems.
Continuous monitoring helps identify abnormal conditions before they affect production.
How to Choose a Turbidity Analyzer
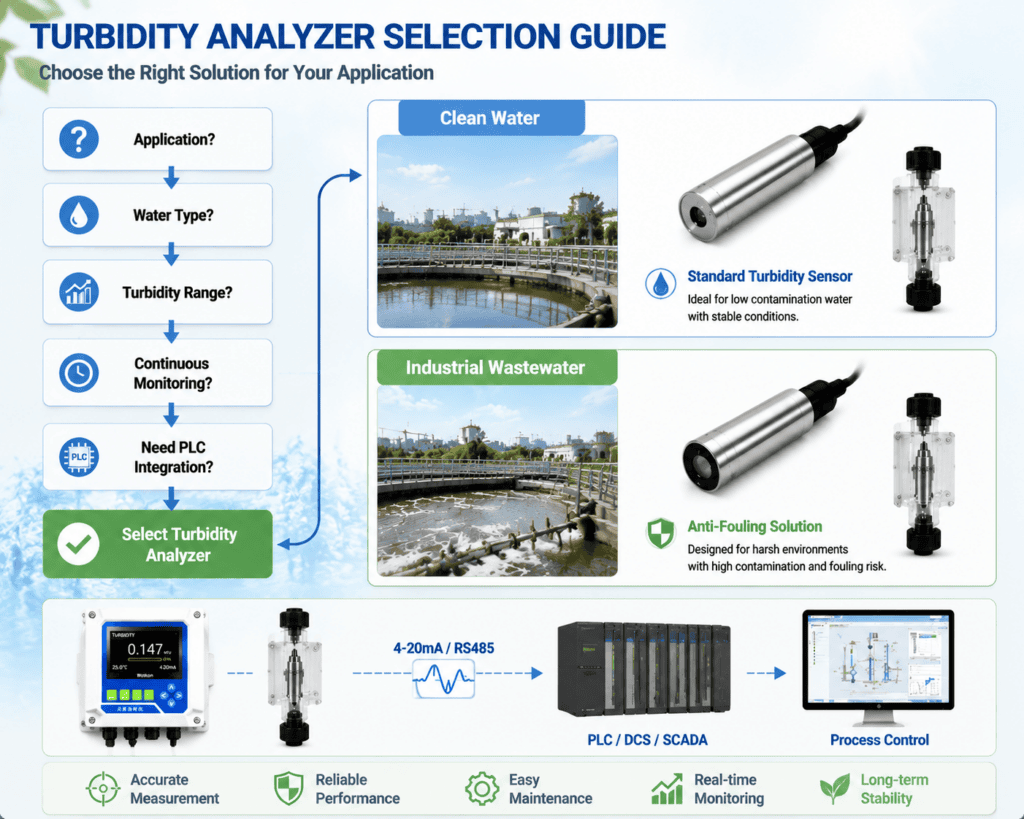
Selecting the right turbidity analyzer requires evaluating the actual application conditions.
The main factors include:
- Measurement range.
- Accuracy requirements.
- Water characteristics.
- Cleaning capability.
- Communication requirements.
- Installation conditions.
1. Measurement Range
The measurement range should match the expected turbidity level.
Different applications require different measurement capabilities.
Low Turbidity Applications
Examples:
- Boiler feed water.
- Filtered water.
- Drinking water.
Requirements:
- High sensitivity.
- Stable low-NTU measurement.
- Strong repeatability.
High Turbidity Applications
Examples:
- Wastewater.
- Raw water.
- Industrial process water.
Requirements:
- Strong contamination resistance.
- Wider measurement range.
- Easy maintenance.
2. Measurement Accuracy
Accuracy requirements depend on the application.
For critical applications such as:
- Environmental compliance.
- Product quality control.
- Equipment protection.
The analyzer should provide:
- Stable optical performance.
- Reliable calibration.
- Good repeatability.
3. Calibration Requirements
Calibration frequency depends on:
- Water quality.
- Sensor design.
- Operating environment.
- Maintenance conditions.
Clean water applications usually require less frequent calibration.
Industrial wastewater applications may require:
- More frequent inspection.
- Automatic cleaning.
- Better fouling resistance.
4. Self-Cleaning Capability
For long-term online operation, sensor fouling is one of the biggest challenges.
Deposits may form on:
- Optical windows.
- Flow cells.
- Sensor surfaces.
Self-cleaning technologies can reduce maintenance requirements.
Common solutions include:
- Automatic air cleaning.
- Ultrasonic cleaning.
- Mechanical wiping.
5. Communication Output
Modern turbidity analyzers are often integrated into automation systems.
Common outputs include:
- 4–20 mA.
- RS485.
- Modbus.
These functions allow:
- Remote monitoring.
- PLC/DCS integration.
- Automatic alarm management.
- Data storage.
6. Diagnostic Functions
Advanced turbidity analyzers may provide:
- Sensor status monitoring.
- Cleaning reminders.
- Calibration alerts.
- Fault diagnosis.
These functions help operators identify problems before measurement failure occurs.
Selecting Between Turbidimeter and Turbidity Analyzer
Although both instruments measure turbidity, they serve different purposes.
Choose a Turbidimeter When:
Suitable for:
- Laboratory testing.
- Field inspection.
- Periodic verification.
Advantages:
- Simple operation.
- Flexible use.
- Lower investment.
Limitations:
- No continuous monitoring.
- No automatic alarm.
- No process control.
Choose a Turbidity Analyzer When:
Suitable for:
- Continuous monitoring.
- Industrial processes.
- Environmental compliance.
- Automatic control.
Advantages:
- Real-time measurement.
- Continuous data.
- PLC/DCS integration.
- Alarm capability.
Turbidimeter vs Turbidity Analyzer Comparison
| Item | Turbidimeter | Turbidity Analyzer |
|---|---|---|
| Measurement Method | Manual sampling | Continuous online measurement |
| Main Purpose | Testing and verification | Process monitoring |
| Data Recording | Manual | Automatic |
| Alarm Function | Usually unavailable | Supported |
| PLC Integration | Limited | Supported |
| Best Application | Spot checks | 24/7 monitoring |
Common Turbidity Analyzer Problems and Troubleshooting
Even with a high-quality turbidity analyzer, measurement problems may still occur during long-term operation.
In many practical applications, abnormal turbidity readings are not caused by instrument accuracy problems alone.
The complete measurement system should always be considered, including:
- Sensor condition.
- Optical surface cleanliness.
- Flow cell design.
- Sampling stability.
- Installation environment.
- Calibration practices.
Before replacing a turbidity analyzer, engineers should first identify the actual cause of measurement deviation.
Problem 1: Turbidity Reading Is Higher Than Expected
Possible Causes
Optical Window Fouling
Because turbidity measurement relies on light scattering, any contamination on the optical surface can affect the measurement signal.
Common contaminants include:
- Suspended solids.
- Mineral deposits.
- Metal hydroxide precipitation.
- Organic deposits.
- Biofilm.
When deposits accumulate:
- The optical path changes.
- Light scattering conditions are affected.
- NTU values may gradually increase.
Air Bubble Interference
Air bubbles may be detected as suspended particles because they also scatter light.
Common causes include:
- Unstable sample flow.
- Excessive turbulence.
- Poor pipeline design.
- Pump suction problems.
Possible results:
- False high turbidity readings.
- Measurement fluctuation.
- Unstable data.
Poor Sampling Conditions
A turbidity analyzer can only provide reliable results when the sample represents the actual water condition.
Possible problems:
- Incorrect sampling point.
- Low flow velocity.
- Sediment accumulation.
- Dead zones in pipelines.
Recommended Solutions
Check:
- Optical window condition.
- Flow cell cleanliness.
- Sample flow stability.
- Bubble generation.
- Calibration status.
Problem 2: Turbidity Reading Fluctuates Frequently
Possible Causes
Unstable Flow Conditions
Changes in flow velocity may affect particle distribution inside the measurement chamber.
This can cause:
- Rapid NTU changes.
- Poor repeatability.
- False alarms.
Real Water Quality Variation
Some applications naturally experience turbidity changes.
Examples:
- Wastewater treatment.
- Raw water intake.
- Industrial production processes.
In these cases, operators need to determine whether the fluctuation is caused by the process or the measurement system.
Incorrect Installation Location
Poor installation may cause:
- Non-representative samples.
- Excessive turbulence.
- Particle settling.
Recommended Solutions
- Verify the installation position.
- Stabilize sample flow.
- Remove air bubbles.
- Check whether process conditions are changing.
Problem 3: Online Turbidity Value Does Not Match Laboratory Results
This is one of the most common problems reported by users.
The first reaction is often to suspect the analyzer accuracy.
However, the difference may come from the complete measurement process.
Possible Causes
Different Sampling Conditions
The online analyzer and laboratory sample may not represent the same water condition.
Differences may include:
- Sampling location.
- Sampling time.
- Sample transportation.
- Particle settling.
Sensor Contamination
The online sensor operates continuously in the process environment.
Over time:
- Deposits may accumulate.
- Optical performance may change.
- Measurement drift may occur.
Calibration Difference
Incorrect calibration procedures may create deviation between online and laboratory values.
Troubleshooting Steps
Before replacing the analyzer:
- Compare samples under the same conditions.
- Clean the optical surface.
- Verify calibration.
- Inspect the flow system.
- Confirm sample representativeness.
Problem 4: Frequent Calibration Is Required
Frequent calibration usually indicates that the monitoring system requires improvement.
Possible causes:
- High particle loading.
- Lack of cleaning system.
- Unsuitable sensor selection.
- Poor sampling design.
- Optical contamination.
Possible Improvements
Solutions may include:
- Selecting a suitable turbidity analyzer.
- Adding automatic cleaning.
- Improving flow cell design.
- Optimizing maintenance intervals.
From Our Field Experience:
Turbidity Analyzer Drift in Electroplating Wastewater Was Caused by Fouling, Not Sensor Failure
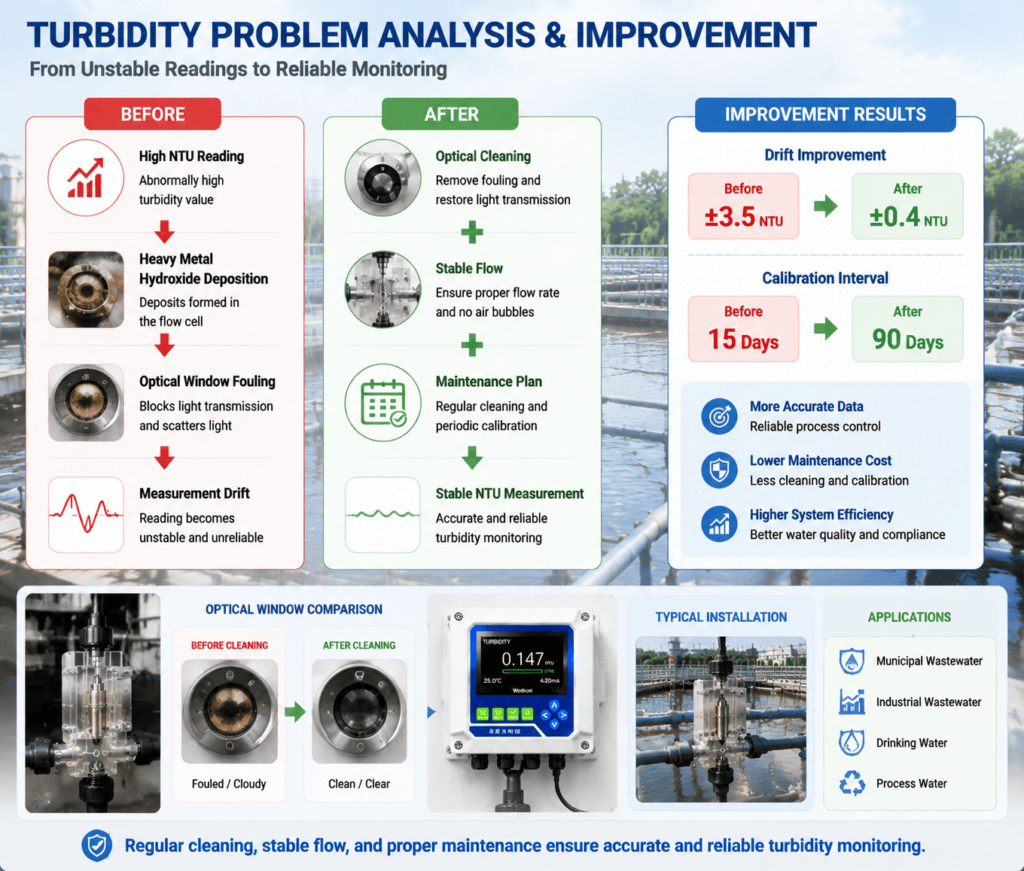
In industrial wastewater applications, abnormal turbidity readings are not always caused by analyzer accuracy problems.
We worked with an electroplating wastewater treatment facility where an online turbidity analyzer was installed to monitor combined wastewater discharge.
The customer found that the turbidity reading gradually increased over time.
The main problems included:
- Online turbidity values remained higher than laboratory test results.
- The analyzer frequently triggered alarms.
- Calibration was required repeatedly.
- Operators suspected sensor failure.
However, after inspection, our engineers found that the analyzer itself was operating normally.
The actual problem was related to the measurement environment.
Root Cause Analysis
The wastewater contained heavy metal compounds.
During treatment, metal hydroxide precipitation gradually accumulated on:
- The optical window.
- The inner wall of the flow cell.
These deposits changed the optical scattering conditions and caused gradual upward measurement drift.
In addition, unstable sampling flow created small air bubbles in the pipeline.
The combined effects caused:
- Increased measurement deviation.
- Frequent false alarms.
- Short calibration intervals.
Improvement Measures
The solution included:
- Cleaning the optical measurement components.
- Improving flow cell maintenance.
- Stabilizing sample flow conditions.
- Reducing bubble interference.
- Optimizing calibration procedures.
Results After Improvement
After the modification:
- Turbidity drift was reduced from ±3.5 NTU to within ±0.4 NTU.
- Calibration interval increased from 15 days to 90 days.
- Daily maintenance workload decreased by 75%.
- False alarms caused by measurement drift were significantly reduced.
This project demonstrated that reliable turbidity monitoring depends not only on analyzer performance, but also on:
- Optical cleanliness.
- Flow cell design.
- Sampling stability.
- Proper maintenance strategy.
Turbidity Analyzer Maintenance Best Practices
Proper maintenance is essential for maintaining long-term turbidity measurement stability.
1. Keep Optical Surfaces Clean
The optical window directly affects measurement accuracy.
Recommended actions:
- Inspect optical surfaces regularly.
- Remove deposits promptly.
- Use automatic cleaning systems for difficult applications.
2. Maintain Stable Sampling Conditions
A reliable sampling system should provide:
- Representative water samples.
- Stable flow.
- Minimal bubbles.
- Proper installation conditions.
Sampling problems are one of the most common reasons for inaccurate turbidity measurements.
3. Perform Regular Calibration
Calibration frequency depends on:
- Water characteristics.
- Measurement requirements.
- Sensor design.
- Operating conditions.
Recommended practices:
- Follow calibration procedures.
- Use appropriate reference standards.
- Adjust maintenance intervals according to actual conditions.
4. Monitor Analyzer Status
Advanced turbidity analyzers may provide diagnostic functions.
Operators should regularly check:
- Sensor status.
- Cleaning condition.
- Calibration reminders.
- Alarm history.
Early identification of abnormal conditions helps prevent unexpected measurement failure.
Frequently Asked Questions
What is a turbidity analyzer used for?
A turbidity analyzer measures suspended particles in water by detecting light scattering.
It is widely used in:
- Drinking water treatment.
- Industrial wastewater.
- Power plants.
- Beverage production.
- Process water systems.
What is the difference between a turbidity analyzer and a turbidity meter?
A turbidity meter or turbidimeter is mainly used for manual testing.
A turbidity analyzer is designed for continuous online monitoring and industrial process control.
How does a turbidity analyzer measure NTU?
A turbidity analyzer sends light into a water sample and measures the scattered light caused by suspended particles.
The signal is converted into an NTU value.
Why does my turbidity analyzer reading keep increasing?
Common causes include:
- Optical window fouling.
- Flow cell deposits.
- Suspended particle accumulation.
- Air bubble interference.
- Poor sampling conditions.
The complete measurement system should be checked before replacing the instrument.
How often should a turbidity analyzer be calibrated?
Calibration frequency depends on:
- Water quality.
- Application conditions.
- Measurement stability requirements.
Industrial wastewater applications usually require more attention to cleaning and calibration management than clean water applications.
Conclusion
A turbidity analyzer is an important instrument for monitoring water quality in industrial and municipal applications.
Compared with manual turbidity testing, online turbidity analyzers provide:
- Continuous measurement.
- Real-time monitoring.
- Automatic alarms.
- Data recording.
- Process integration.
When selecting a turbidity analyzer, users should consider:
- Measurement range.
- Accuracy requirements.
- Water characteristics.
- Cleaning capability.
- Communication functions.
- Maintenance requirements.
However, reliable turbidity monitoring requires more than choosing a high-quality instrument.
A complete solution should include:
- Correct sensor selection.
- Proper installation.
- Stable sampling conditions.
- Effective cleaning strategy.
- Regular calibration.
By matching the turbidity analyzer with the actual application requirements, users can improve measurement reliability, reduce maintenance workload, and achieve better water quality management.
Turbidity Monitoring Solutions
Reliable turbidity monitoring requires a complete solution rather than only a measurement device.
Wuxi Wohuan Instrument provides complete turbidity monitoring solutions, including:
- Online turbidity analyzers
- Turbidity sensors
- Portable turbidity testers
- Turbidity transmitters
- Flow cell sampling systems
- Automatic cleaning solutions
- Industrial water quality monitoring systems
Our solutions are designed for:
- Industrial wastewater.
- Drinking water treatment.
- Boiler feed water.
- Beverage production.
- Water reuse systems.
- Process water monitoring.
Based on water characteristics, monitoring requirements, and installation conditions, our engineering team helps customers select suitable turbidity monitoring solutions to improve measurement stability and reduce long-term operating costs.
Need Help Choosing the Right Turbidity Analyzer?
Selecting the correct turbidity analyzer depends on more than the NTU measurement range.
A suitable solution should consider:
- Application type
- Water characteristics
- Measurement frequency
- Installation environment
- Communication requirements
- Maintenance expectations
Whether you need an online turbidity analyzer for continuous monitoring or a turbidity meter for routine testing, our engineering team can help evaluate your application and recommend the right solution.
Explore Related Solutions
Explore more industrial water quality monitoring solutions:
- Online Turbidity Analyzer
- Residual Chlorine Analyzer
- pH Analyzer
- ORP Analyzer
- Dissolved Oxygen Analyzer
- Conductivity Analyzer
- Multi-Parameter Water Quality Analyzer
Our engineers provide technical recommendations based on your process conditions and monitoring requirements.
Request a Free Consultation
Please provide:
- Application or industry
- Water type
- Expected turbidity range
- Installation method
- Sampling conditions
- Communication requirements
- Maintenance expectations
Our engineering team will recommend the most suitable turbidity monitoring solution and provide technical support for reliable long-term operation.